Clean tabular data
Clean tabular data first: fix blanks, duplicates and inconsistent labels. Analysis of dirty data produces confident nonsense.

Data does not speak for itself. People make it speak, and sometimes they make it lie.
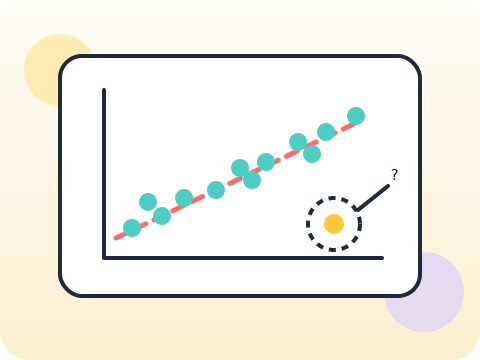
Students clean a real dataset, ask questions of it, use AI to help interpret charts, and practise stating conclusions with an honest level of confidence.
Data literacy is protection. Students are shown statistics daily and are rarely taught how to interrogate them.
Three core ideas, each taught with worked examples and then practised until it feels obvious.
Clean tabular data first: fix blanks, duplicates and inconsistent labels. Analysis of dirty data produces confident nonsense.
Questioning data means asking who collected it, from whom, when and why. Every dataset has a point of view.
Chart interpretation means reading the axes and the sample size before reacting to the shape.
Ice-cream sales and drowning incidents rise together. Neither causes the other — hot weather causes both. This is why correlation is not causation.
“A big sample means a good study.” A large but skewed sample can be far more misleading than a small, careful one.
Sessions 25–32 of the 72-session year, at two one-hour sessions per week.
Where this module fits, what you will build, and a hands-on starter that gets everyone curious about clean tabular data.
Guided teaching on clean tabular data, worked through together with the teacher.
Independent practice, small challenges and one deliberate mistake to diagnose.
Guided teaching on questioning data, building directly on the previous two sessions.
Applied tasks that combine clean tabular data and questioning data in one piece of work.
Chart interpretation introduced and practised, completing the toolkit needed for the project.
Guided build session for the module project: Survey analysis findings poster.
Finish, test against the checklist, present the work and explain the decisions behind it.
Every module ends with something the student built themselves and can demonstrate. This is the piece that goes into their portfolio and gets explained out loud at the end of session 32.
Survey your year group, then write two honest headlines from the same data — one that oversells it and one that is accurate.
Students finishing Module 4 can:
The vocabulary introduced here, in plain language:
6 quick questions drawn from this module — vocabulary, the project you build, and a myth-or-fact round. Every wrong answer explains itself, so a mistake still teaches you something.
Tell us your child’s class and what they enjoy. We will suggest the closest program fit—no pressure and no upfront payment.